Dynatrace automatically creates Problems for all anomalies it detects itself, or which are sent via API calls, extensions, or external event integrations.
In some situations, such as during planned patch installations (software or OS updates), these Problems are not relevant. They typically occur temporarily — for example:
- A server reboot during a patch cycle
- An application that cannot connect to a database while the DB host is in maintenance
- A process restart causing short-lived unavailability
In such cases, you don’t want these Problems to trigger alerts to your support staff. This is where Maintenance Mode comes in.
Background
When Dynatrace creates a Problem, Davis® AI analyzes the event to determine:
- Impacted entities (all components affected)
- Root cause(s) (the entities that triggered the issue)
The Problem is then enriched with metadata such as properties and tags from the involved entities.
If at the time of creation Dynatrace finds an active Maintenance Mode rule that matches any of the entities or tags linked to the Problem, the Problem is marked as “in maintenance.”
Effect of Maintenance Mode
When a Problem is marked as being in maintenance in Dynatrace, it only has slight differences with the normal Problems, so you need to understand the nuances and make sure to use this in a good way. These are some characteristics of a Problem when marked as being in maintenance:
- It will be visible in the Problems app (both current and classic) as “under maintenance.”
- Default problem notifications (email, integrations, etc.) are not executed.
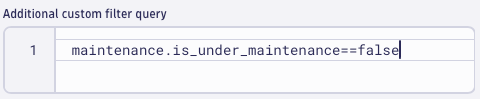
- Any custom workflows you have for Davis problem events should explicitly check the field:
"maintenance.is_under_maintenance"
We recommend using this field in your trigger filters, so maintenance Problems don’t trigger automated handlers.
Why Hosts and Tags are currently the most effective targets
In this first version, the Maintenance Mode Manager App focuses on Hosts and Tags as primary entry points for setting maintenance windows. This choice is intentional: both offer strong coverage of the Dynatrace topology and are practical starting points for reliable suppression.
- Hosts provide deep coverage because when a host is placed into maintenance, nearly all entities running on that host – such as processes, services, and infrastructure components – are automatically suppressed. This makes host-based maintenance ideal for full-system patching, restarts, or OS-level work.
- However, this approach has limitations for modern workloads. For example, Kubernetes entities or custom devices often aren’t tied 1:1 to physical hosts and may exist in abstract layers. As such, host-based suppression doesn’t reliably apply to them.
That’s where tag-based maintenance comes in. By leveraging consistent and well-defined tagging strategies, you can target maintenance windows to exactly the entities that matter – across layers, technologies, or team boundaries. This gives you flexibility and precision without needing to know every component in the path.
Dynatrace will annotate problems as “Occurred during maintenance” only if the impacted or root-cause entity is in maintenance. Therefore, placing the right entities under maintenance is critical – and the use of tags gives you full control over that scope.
Initial set-up of the App
To install Maintenance Mode Manager, make sure you have the appropriate rights to install Applications on the platform, and edit the specific application settings.
IctCoreBiz has a download link of the App on her site, where you can download the versioned App and an archive. Save this archive to your local disk. Now login to your Dynatrace tenant and follow the below steps.
Steps:
Expand this section to see the steps
1. Download and save the app-archive to a local storage
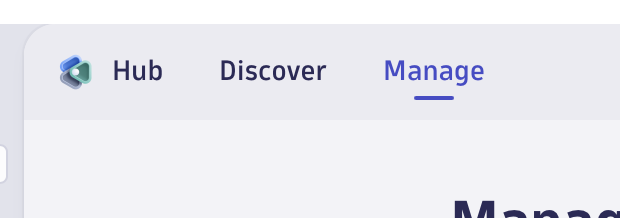
2. Open the Hub app in Dynatrace and select the “Manage” menu item
3. Upload the App to the Dynatrace tenant with the upload button
4. Create a user policy to use the app, containing the following rights:
// Allow the APP to be started and use app-state for caching
ALLOW app-engine:apps:run,state:app-states:read,state:app-states:write WHERE shared:app-id = "my.maintenance.mode.manager";

// Allow the APP to use its own application settings
ALLOW app-settings:objects:read WHERE settings:schemaId = "biz.ictcore.maintenance-mode-manager.settings";

// Allow the APP to read and write maintenance windows
ALLOW settings:objects:read, settings:objects:write WHERE settings:schemaId = "builtin:alerting.maintenance-window";

// Allow the APP to show entities like hosts / tags. This can be restricted when needed
ALLOW storage:entities:read;

// Allow the APP to write log records of executed actions
ALLOW storage:logs:write;

// Allow the APP to show open problems when closing maintenance windows
ALLOW storage:events:read;
5. Assign the user policy to the users that need to be able to use the App in their work
6. In settings => preferences => limit outbound connections add ictcore.biz to the allow-list (if this functionality is enabled). This is required for the automatic license checks.
Once you have configured all of the above, the App can be started, but first needs to be configured in the App-Settings.
Settings
After installation of the App, there will be a new section in settings => Dynatrace Apps, called [MMM] Maintenance Mode Manager Settings. In this screen we will have to implement a number of settings for the application to work / be optimized for your use.
Expand this section to see what settings to configure / tune
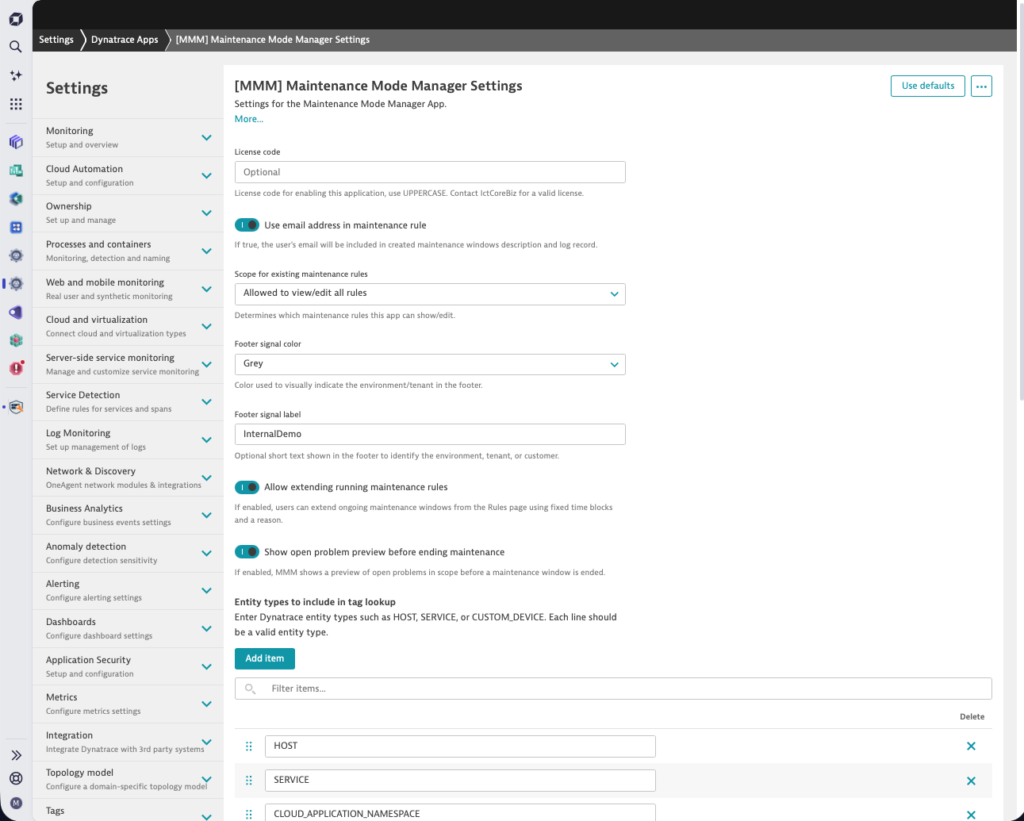
In the above screen you will be able to configure all settings to your own preference.
- License Code
This is the license code you have obtained from us. When the license is generated by IctCoreBiz, it is not yet bound to a specific tenant. Once you enter the code here, and start the app, the license will be activated and bound only to this tenant. Licensing during application startup/reload is a simple process, that checks whether your current license is valid and bound to the current tenant. If not, the App will report that it will be running in “Demo” mode, which means that you can do all actions, but the actual writing/updating of the maintenance mode is not executed. - Use email address in maintenance rule
By default you would like to see which user created/updated the maintenance rule when using Maintenance Mode Manager, but it might be that you would not have this visible in the record for privacy reasons. If you disable this setting, there will be a dummy email address (unknown@example.com) shown in the generated comment messages. - Scope for existing maintenance rules
In the App, you can disable running maintenance windows. For this, the user gets a list of maintenance windows presented with options to stop the maintenance window instantly (by setting the end-time to the current time). Since the users creating Maintenance windows using the App, might be different from the creators of other Maintenance windows (e.g. admins creating advanced rules in the Dynatrace interface / API), this setting allows you to limit the rules that you want to show to the user. For this there are 3 options:- Allowed to view/edit all rules
The list of Maintenance window rules available in Dynatrace will not be filtered by the App, hence you will see and potentially stop all available rules. - Allow to view/edit only App generated rules
Filter the Maintenance Window rules, and only show those that are created with this App. The filter is a very simple one, it will look whether the Maintenance Window name contains the prefix[MMM]. - Not allowed to view/edit rules
The Maintenance window rules are not displayed to the user. Instead a message will appear in the App that the functionality has been disabled by the administrator.
- Allowed to view/edit all rules
- Footer signal color
The Footer signal color is used to provide a clear, persistent visual indication of the Dynatrace tenant you are currently working in.
In environments where users have access to multiple Dynatrace tenants (for example production, acceptance, and test), it is easy to unintentionally perform actions in the wrong tenant. The footer signal color helps prevent this by assigning a distinct color per tenant, making the active tenant immediately recognizable at all times.
The selected color is displayed in the application footer and remains visible on every page of the Maintenance Mode Manager.
Use the Footer signal color when:- You regularly switch between multiple Dynatrace tenants
- Maintenance windows are created, modified, or ended manually
- You want to reduce the risk of human error when managing maintenance in critical environments
- Footer signal label
An optional text of maximal 15 characters to indicate the role of function of this tenant. This will be shown as a badge in the (colored) footer. - Allow extending running maintenance rules
If enabled, users can extend ongoing maintenance windows from the Rules page using fixed time blocks and a reason. This can be used for support employees or change executors to prolong the window in which they can work on some entities. - Show open problem preview before ending maintenance
If enabled, MMM will show an overview of open problems before you close the maintenance window. This can be very helpful to see whether you don’t have any “leftover” problems from the change you executed. The query will be done in the open problems, with the exact same filter as that was used for the creation of the maintenance window that you are trying to close. - Entity types to be included in tag lookup
In Dynatrace there is no specific entity where all used tags are registered, instead the App will examine specific entity types and determine Tag-names and used values inside those tags. Since every environment and customer tagging-strategy is different, you can determine your own preferences for which entities will be scanned to offer the list of tags to the user.
Often, HOST / SERVICE / and for kubernetes CLOUD_APPLICATION_NAMESPACE, will be a good start for this list, but if your environment has e.g. custom entity types created in extensions, this is the place to include those entities as well.
Remark: This set of entity-types is ONLY used in the App to determine Tagging information; once the tag is used in a Maintenance Window rule, Dynatrace will validate it against the generated Problems, hence it works for all tagged entities that are causing/impacted in problems. - Max hosts to fetch
By default Maintenance Mode Manager reads a maximum of 1000 hosts for the hosts-screen. This setting allows you to increase the maximum number of hosts to maximum of 15000. - Max entities per type for tag lookup
For determining tags, Maintenance Mode Manager reads the entities from the types you defined above. e.g. if you define HOST as entity type, it will read a maximum of HOSTS as defined here, to determine the used tags and tag values. So if you have more than 1000 hosts, but they are all tagged in exactly the same way, you don’t need to read them all, if you have vaery many different tag values, you should try to read more entities.
How to use the App in practice
Basically 3 use-cases: Create Maintenance windows for Hosts, for Tags or stop a maintenance window (by changing the end-time of the window to the current time).
How-to: Creating a Maintenance Window for a Host
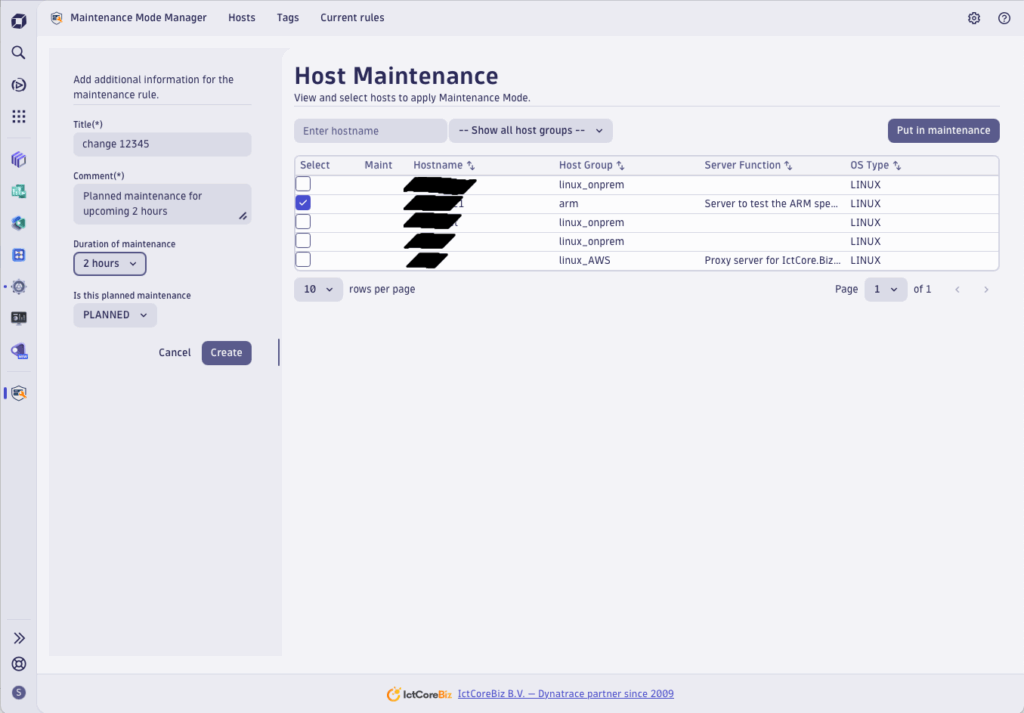
- Open the Maintenance Mode Manager app in your Dynatrace environment.
- Go to menu item “Hosts.”
- Browse or search for the host(s) you want to put into maintenance.
- Use filters like Host group or type a part of the hostname to narrow down the list.
- Select the checkbox next to the relevant host(s).
- Click “Put in maintenance”.
- In the side panel, provide the details:
- Title → a short description of the maintenance (e.g. “Patching Linux nodes”)
- Comment → context for the change (e.g. “OS patching for security update CVE-…”)
- Duration → pick from predefined times (10 minutes, 1 hour, etc.)
- Type → Planned or Unplanned
- Confirm and create the maintenance window.
🔎 Note: Putting a host in maintenance automatically covers most entities running on it (processes, services, etc.).
Extra option: If you tag a host with a tag named server_function, the value of that tag will be shown in the hosttable. In this way you can make it even easier for operators to know which host to put in maintenance.
Extra visual: If a host is put into maintenance with the app, you will see a wrench symbol to indicate it curently is in maintenance mode.
How-to: Creating a Maintenance Window for one or more Tags
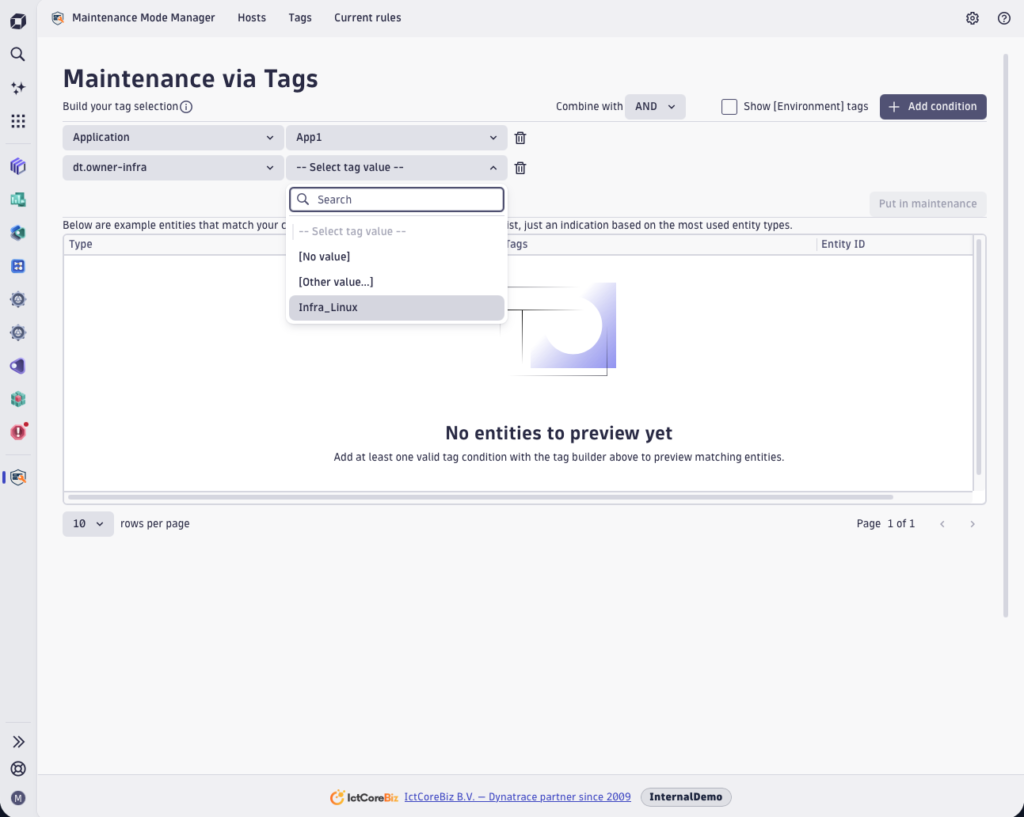
- Open the Maintenance Mode Manager app.
- Go to the menu item “Tags.”
- At the top of the builder you can define whether or not you want to see [Environment] tags in the Tag key pulldown list.
- In the Tag selection builder, press the “+ Add condition” button and add one or more tag conditions:
- Tag key: choose a key such as Application or Environment.
- Tag value: choose a value such as myweb or Production.
- If [No value] is selected, the rule applies to all entities with that tag key, regardless of value.
- If [Other value…] is selected, you can enter a free value in the textbox. This is useful if the app has not autodetected the tag value you need.
- Use Add condition to include more tag conditions.
- You can remove individual tag conditions with the “garbage bin” at the end of the line.
- In the list under the Tag selection builder, you see a subset of the entities that match your current tag conditions.
- At the top right of the builder, select how conditions should be combined:
- AND → only entities that match all conditions will be included.
- OR → entities that match at least one condition will be included.
- When ready, click Put in maintenance.
- In the side panel, provide the details:
- Title → e.g. App myweb rollout
- Comment → e.g. Deployment of new version to myweb app in production.
- Duration → select how long the maintenance should last
- Type → Planned or Unplanned
- Confirm to create the maintenance window.
🔎 Tip: Tag-based maintenance windows are ideal for covering non-host entities, like Kubernetes workloads or custom devices, which are not directly tied to a single host.
How-to: Ending a Maintenance Window
Maintenance windows can end automatically when their scheduled time runs out, but sometimes you may want to stop them earlier (e.g. when a change is completed ahead of schedule). Be aware that removing a maintenance window (in API/UI) also stops the maintenance window, but also removes the important information / annotations on various screens; so only “stop” the windows, don’t remove recent maintenance windows. This is also why this use-case is not available in Maintenance Mode Manager.
- Open the Maintenance Mode Manager app.
- Navigate to the “Maintenance rules” page.
- Use the status filter at the top to select “Ongoing”.
- This ensures you only see rules that are currently active.
- In the list, locate the maintenance window you want to end.
- Click the “End maintenance” button in the last column of that row.
- A confirmation dialog will appear, showing the name of the maintenance rule.
- Review the details to ensure you are ending the correct window.
- Select a corresponding reason or Other to define your own tekst
- Click End Maintenance to proceed.
- The maintenance window will be closed immediately, and a note will be appended to its description (e.g. “Maintenance mode ended by john.doe@company.com. Reason: Maintenance ended earlier”).
🔎 Tip: Ending a window early helps restore alerting and problem notifications sooner, so your monitoring visibility is not unnecessarily suppressed.
How-to: Extending a Maintenance Window
Maintenance sometimes takes longer than expected, in that case you need to extend the maintenance window to make sure new problems will not be seen as real issues.
- Open the Maintenance Mode Manager app.
- Navigate to the “Maintenance rules” page.
- Use the status filter at the top to select “Ongoing”.
- This ensures you only see rules that are currently active.
- In the list, locate the maintenance window you want to extend.
- Click the “Extend” button in the last column of that row.
- A confirmation dialog will appear, showing the name of the maintenance rule.
- Review the details to ensure you are extending the correct window.
- Select a correct duration of the extension
- Select a corresponding reason or Other to define your own tekst
- Click Extend to proceed.
- The maintenance window will be extended immediately by adding the extra time to the current end-time, and a note will be appended to its description (e.g. “Maintenance mode extended by 60 minutes by john.doe@company.com. Reason: Work not yet ready”).
Frequently Asked Questions
Licensing
Yes. A license can be activated for a specific Dynatrace tenant. If you need to reassign it, you send a service request for deactivation to the support mail address, and once we deactivate your current tenant you can apply it to a new environment.
The app validates your license automatically against our license server when it starts. If the license is invalid or expired, the app will switch to demo mode with limited functionality.
The Dynatrace Apps are licensed per year, per tenant. The first activation / use of a licensecode, encodes the tenant name in our backend, to validate.
Maintenance Mode Manager
No. This app focuses on simplicity for day-to-day operations. Recurring or complex schedules remain available in the native Dynatrace configuration.
Each Dynatrace environment supports up to 2,000 maintenance windows. This includes all windows, whether they are active, scheduled or expired; regardless whether created by UI or API.
If you try to create more than 2,000 maintenance windows, the system will not allow this until you delete one or more existing maintenance windows.
Once you reach 1800 defined maintenance windows in the system, the Maintenance Mode Manager app will show a warning to the user interface, once you reach 1950 defined windows, it will give you a “critical warning”, that you have to manually dismiss.
It may be tempting to delete expired windows quickly to “keep things tidy,” but in practice it’s often better to keep them for a while:
- Audit & reporting – Old windows provide context for why certain alerts or problems were suppressed at specific times.
- Troubleshooting – When investigating past incidents, knowing that a maintenance window was active can explain why alerts didn’t fire.
Dynatrace will still detect the issue, but if the impacted or root-cause entity is in maintenance, the problem will be annotated accordingly and alert-notification will be suppressed.
Once a maintenance window is defined, Dynatrace automatically excludes the configured time period from baseline calculations. This means that anomalies (such as higher response times) occurring during maintenance won’t distort the overall service and application baselines.
Parent and group relationships
In determining the scope of a maintenance window, Dynatrace considers entity parent and group relationships.
If a parent entity is scoped within a maintenance window, its immediate children are considered to be under maintenance as well. For example, if a maintenance window is configured for a host, all its disks are considered to be under maintenance as well. If a problem is raised on a disk, and the parent host is under maintenance, the affected child disk is considered to be under maintenance as well.
If an entity group is scoped within a maintenance window, its immediate members are considered to be under maintenance as well. For example, if a host group falls within a maintenance window, its member hosts are considered to be under maintenance as well. However, the child disks of the parent hosts are not considered to be under maintenance, unless, of course, the hosts are explicitly scoped within the maintenance window.
See: https://docs.dynatrace.com/docs/shortlink/maintenance-window-define#parent-and-group-relationships
Maintenance Mode Manager is designed for operational roles such as application owners, service managers, and service desk teams. It enables them to manage maintenance windows without needing full Dynatrace expertise.
The Dynatrace interface is powerful but complex. Our app provides a simplified, guided experience that helps operational teams avoid mistakes and set up safe maintenance windows in seconds.
Yes, this App is in active maintenance by IctCoreBiz, and will be updated with new functionality regularly. You can use the normal support channels to request specific functionality for new releases.
Maintenance Mode Manager internals
Currently, you can put Hosts and Tags into maintenance. Tags allow you to include related entities such as services, processes, or custom devices. More entry points may be added in future releases.
Why Hosts and Tags are currently the most effective targets
The Maintenance Mode Manager App focuses on Hosts and Tags as primary entry points for setting maintenance windows. This choice is intentional: both offer strong coverage of the Dynatrace topology and are practical starting points for reliable suppression.
- Hosts provide deep coverage because when a host is placed into maintenance, nearly all entities running on that host – such as processes, services, and infrastructure components – are automatically suppressed. This makes host-based maintenance ideal for full-system patching, restarts, or OS-level work.
- However, this approach has limitations for modern workloads. For example, Kubernetes entities or custom devices often aren’t tied 1:1 to physical hosts and may exist in abstract layers. As such, host-based suppression doesn’t reliably apply to them.
That’s where tag-based maintenance comes in. By leveraging consistent and well-defined tagging strategies, you can target maintenance windows to exactly the entities that matter – across layers, technologies, or team boundaries. This gives you flexibility and precision without needing to know every component in the path.
Dynatrace will annotate problems as “Occurred during maintenance” only if the impacted or root-cause entity or its direct parent is in maintenance. Therefore, placing the right entities under maintenance is critical – and the use of tags gives you full control over that scope.